Infographics
Visualisations of scientific concepts or new research, including graphical abstracts.
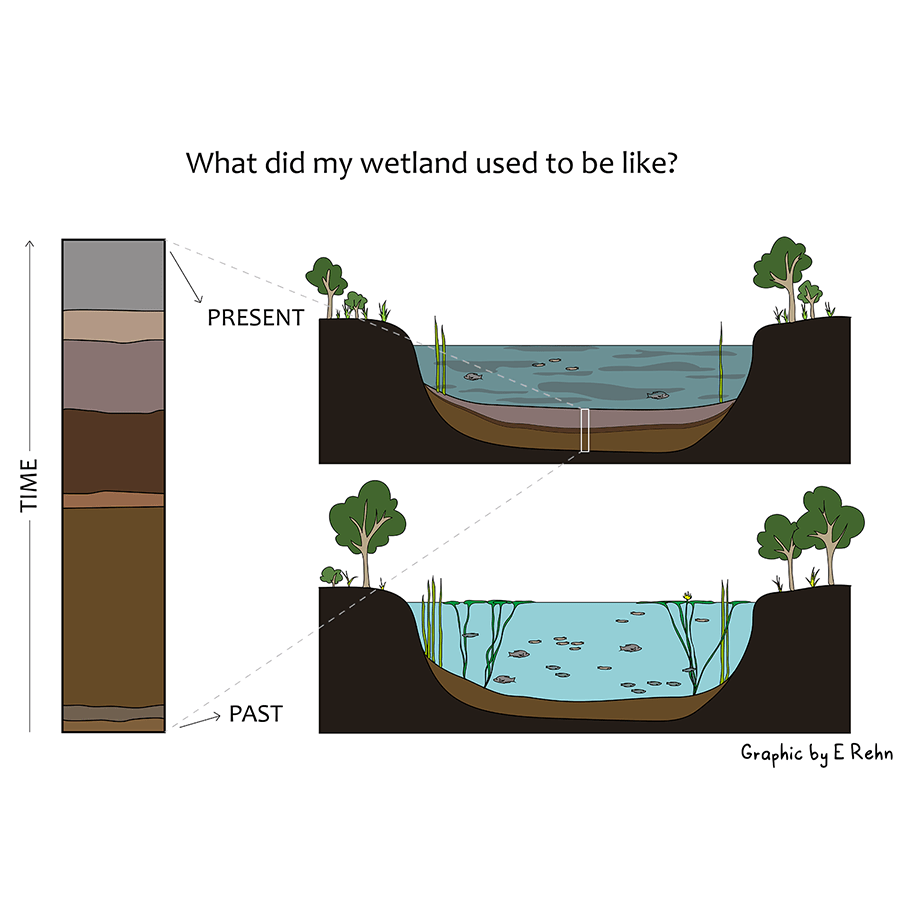
Wetland history
An infographic designed for Dr John Tibby to illustrate key concepts of palaeoecology for reconstructing wetland histories.
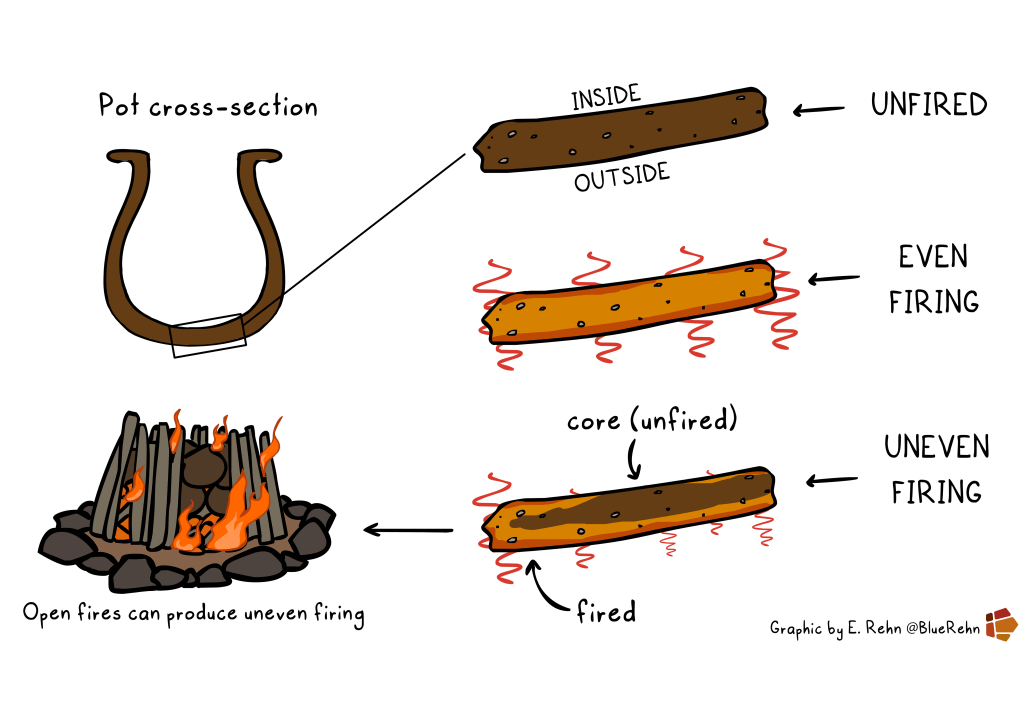
A series of infographics supporting each episode of the podcast Supplementary Information, visually explaining a key concept from the research in each episode
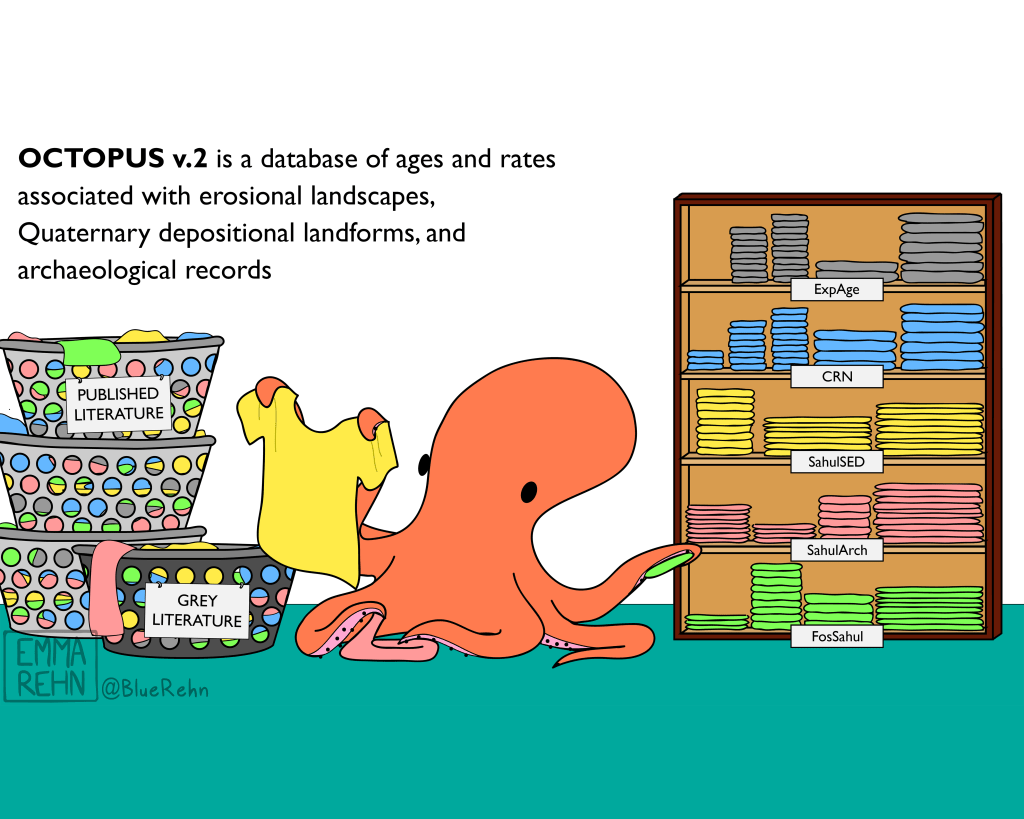
A graphical abstract for an academic publication presenting version 2 of the OCTOPUS database platform
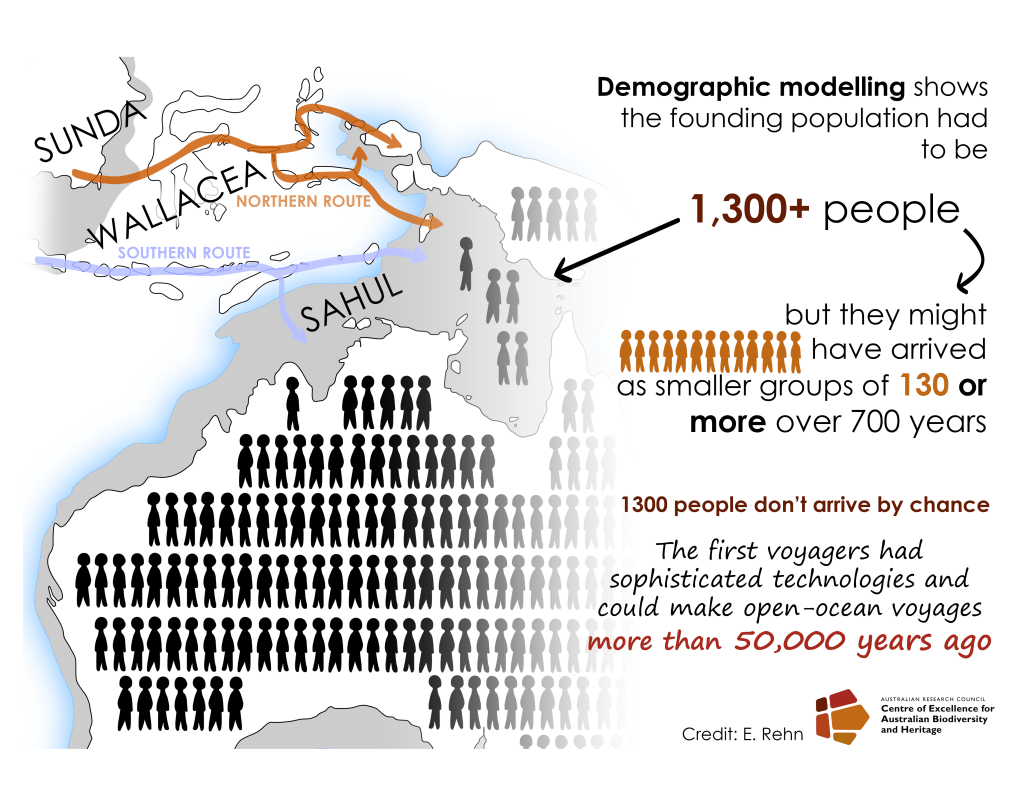
Modelling human arrival in Sahul
An infographic for use on social media to support an academic publication on modelling how many people first arrived on the continent of Sahul over 50,000 years ago

Coring at Girraween Lagoon
An infographic for use on social media to share the ongoing research on sediment cores collected from Girraween Lagoon
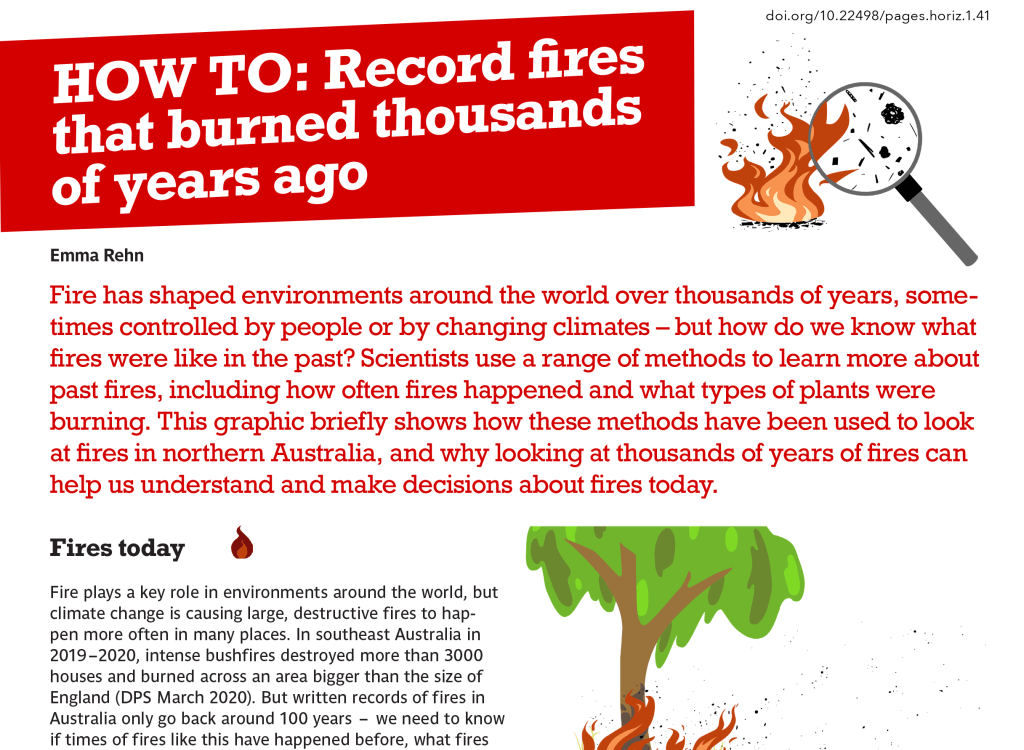
Illustrated article for PAGES Horizons magazine
A collection of infographics and illustrations along with text as an article for teenagers in PAGES Horizons magazine volume 1
Let’s work together
Contact me to discuss how we can capture key findings of your research as engaging and accurate infographics.
